|
Search This Blog
Thursday, May 19, 2022
#Gasoline, at $4.60 average price in #US, is Highest average ever!
Tuesday, May 10, 2022
#BP plans US$10bn stake in #Australia's Asian #RenewableEnergy Hub #AREH
AREH plans to harness 16GW of onshore wind and 10GW of solar to produce renewable H2 and ammonia
$BP plans to take a major stake in the Asian Renewable Energy Hub (AREH) in East Pilbara, one of the world's biggest projects to produce green hydrogen from wind and solar.
The UK-based oil giant is expected to acquire about 30% of the US$36bn AREH, which plans to harness 16GW of onshore wind and 10GW of solar to produce renewable H2 and ammonia, as well as become its lead developer.
One of BP's most ambitious green targets is to develop 50GW of renewables by 2030 and to take major positions both in green hydrogen as well as blue hydrogen from abated gas.
AREH is currently led by developers InterContinental Energy and CWP Global, while wind OEM Vestas and Macquarie are also stakeholders in the Pilbara project, in Western Australia, which aims to begin generating power by 2027.
See the whole release here: BP plans US$10bn stake in Australia's Asian Renewable Energy Hub - report:
Monday, May 9, 2022
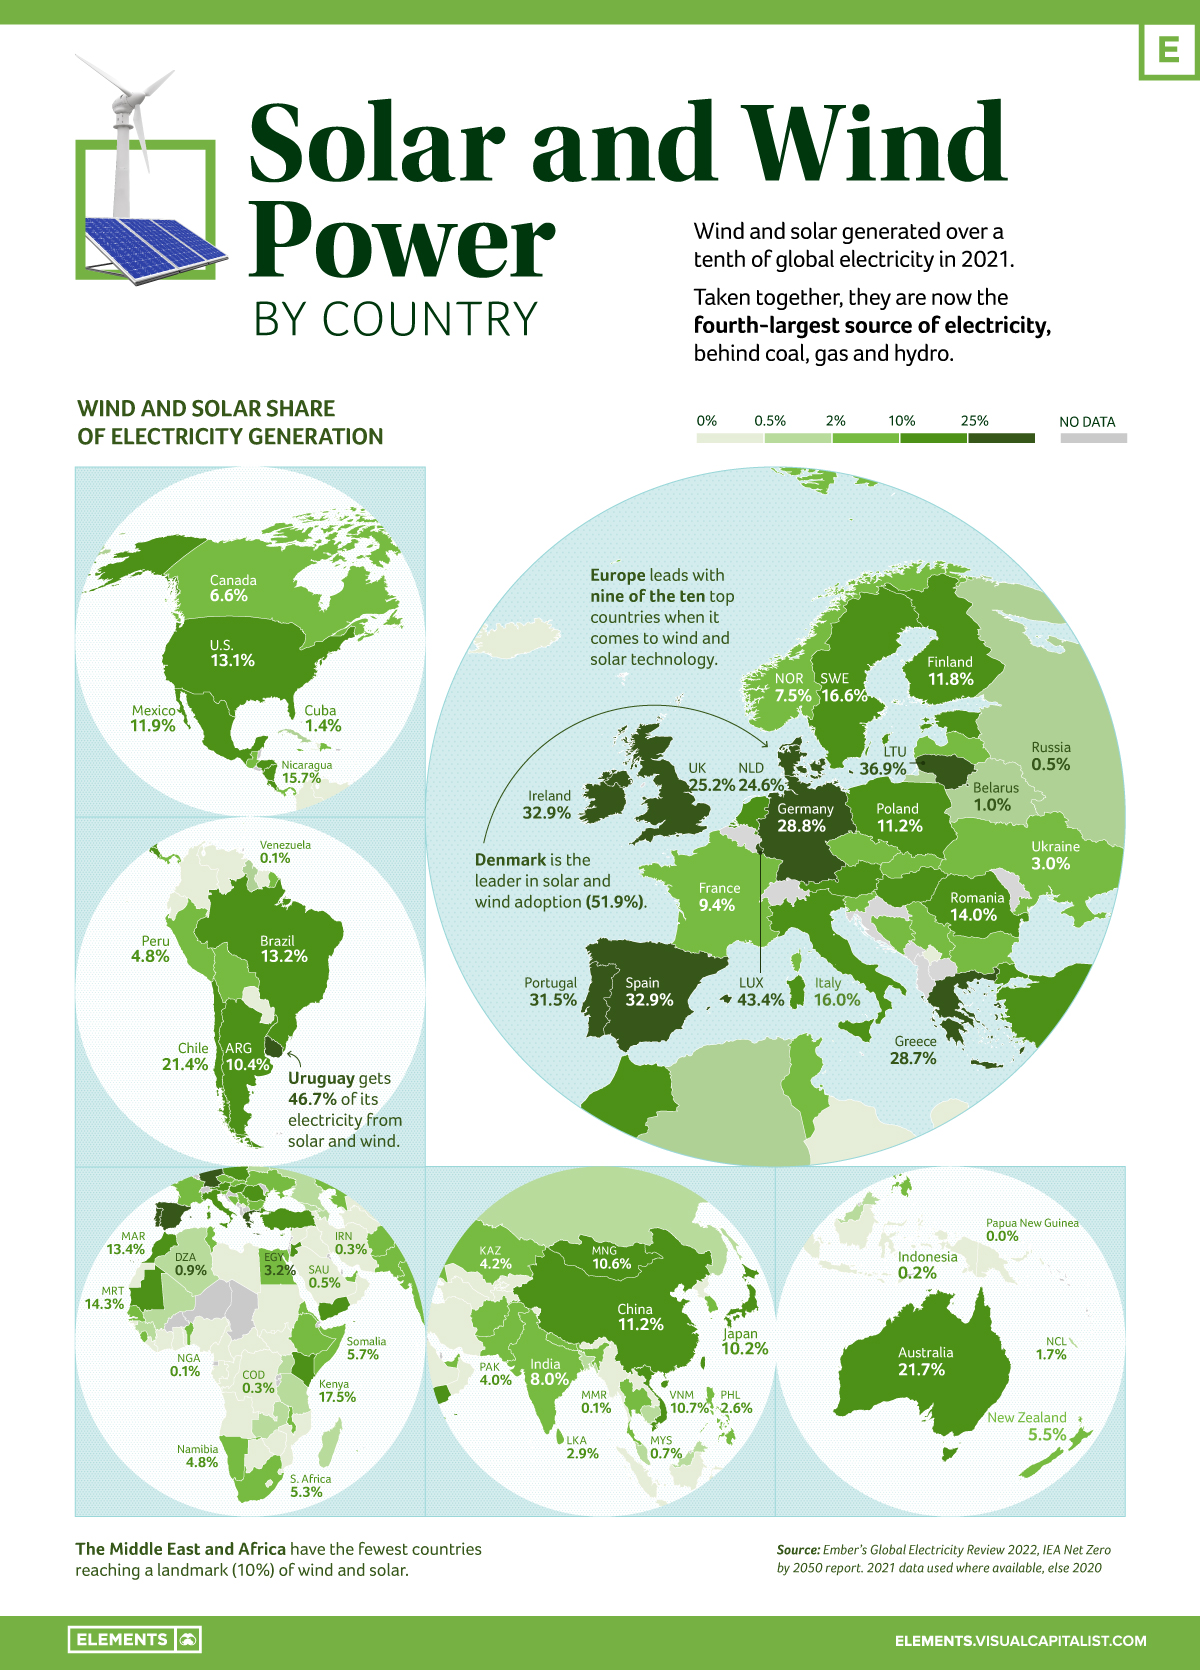
#Wind & #Solar generate +10% of world’s #Electricity. Mapped by Country

Wind and solar generate over a tenth of the world's electricity. Taken together, they are the fourth-largest source of electricity, behind coal, gas, and hydro.
This infographic based on data from Ember shows the rise of electricity from these two clean sources over the last decade.
Europe Leads in Wind and Solar
Wind and solar generated 10.3% of global electricity for the first time in 2021, rising from 9.3% in 2020, and doubling their share compared to 2015 when the Paris Climate Agreement was signed.
In fact, 50 countries (26%) generated over a tenth of their electricity from wind and solar in 2021, with seven countries hitting this landmark for the first time: China, Japan, Mongolia, Vietnam, Argentina, Hungary, and El Salvador.
Denmark and Uruguay achieved 52% and 47% respectively, leading the way in technology for high renewable grid integration.
| Rank | Top Countries | Solar/Wind Power Share |
|---|---|---|
| #1 | 🇩🇰 Denmark | 51.9% |
| #2 | 🇺🇾 Uruguay | 46.7% |
| #3 | 🇱🇺 Luxembourg | 43.4% |
| #4 | 🇱🇹 Lithuania | 36.9% |
| #5 | 🇪🇸 Spain | 32.9% |
| #6 | 🇮🇪 Ireland | 32.9% |
| #7 | 🇵🇹 Portugal | 31.5% |
| #8 | 🇩🇪 Germany | 28.8% |
| #9 | 🇬🇷 Greece | 28.7% |
| #10 | 🇬🇧 United Kingdom | 25.2% |
From a regional perspective, Europe leads with nine of the top 10 countries. On the flipside, the Middle East and Africa have the fewest countries reaching the 10% threshold.
Further Renewables Growth Needed to meet Global Climate Goals
The electricity sector was the highest greenhouse gas emitting sector in 2020.
According to the International Energy Agency (IEA), the sector needs to hit net zero globally by 2040 to achieve the Paris Agreement's goals of limiting global heating to 1.5 degrees. And to hit that goal, wind and solar power need to grow at nearly a 20% clip each year to 2030.
Despite the record rise in renewables, solar and wind electricity generation growth currently doesn't meet the required marks to reach the Paris Agreement's goals.
In fact, when the world faced an unprecedented surge in electricity demand in 2021, only 29% of the global rise in electricity demand was met with solar and wind.
Transition Underway
Even as emissions from the electricity sector are at an all-time high, there are signs that the global electricity transition is underway.
Governments like the U.S., Germany, UK, and Canada are planning to increase their share of clean electricity within the next decade and a half. Investments are also coming from the private sector, with companies like Amazon and Apple extending their positions on renewable energy to become some of the biggest buyers overall.
More wind and solar are being added to grids than ever, with renewables expected to provide the majority of clean electricity needed to phase outfossil fuels.
See the whole post on Visual Capitalist here: https://www.visualcapitalist.com/mapped-solar-and-wind-power-by-country/
