Rating

ShareThis

Thursday, March 22, 2018

How “Green” is your #EV? Depends, says @WEF

The surprising truth behind the world's electric cars | World Economic Forum
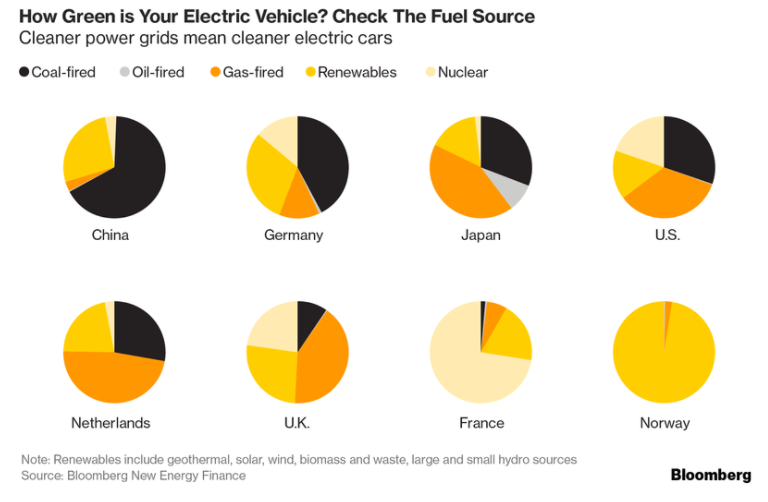
Though electric cars are greener than conventional ones, much of their power still comes from coal.


The surprising truth behind the world's electric cars


Baojun E100 all-electric battery cars are seen while they are being charged in the parking lot in front of a Baojun NEV Experience Center store in Liuzhou, Guangxi Zhuang Autonomous Region, China, November 8, 2017. Picture taken November 8, 2017. REUTERS/Norihiko Shirouzu
Image: REUTERS/Norihiko Shirouzu

The production and sale of electric vehicles accelerated in 2016, with two million cars manufactured and over 750,000 sold globally, according to the International Energy Agency's (IEA) 2017 Global Electric Vehicle report.
And the market is expected to boom further in the coming years. The report predicts electric car stocks will range from between nine million and 20 million by 2020 and between 40 million and 70 million by 2025. Countries around the world are also attempting to ban the sale of petrol and diesel cars, and are encouraging motorists to go green.
However, electric vehicles are not emissions-free. While these vehicles obviously run on electricity, that electricity typically comes from a mix of emissions-intensive fossil fuels, nuclear energy, and power from renewables. That is, unless you live in country like Norway, which generates virtually all of its electricity from hydropower. But Norway is the exception rather than the rule.


Monday, March 5, 2018

Biggest risk to #Oil market lies most likely in #Venezuela @NickBb2211 #Guyana #OPEC #OOTT @FT

There are many-mostly political-risks out there, from Saudi pushback on #MBS' "reforms" to instability/conflict on the Korean Peninsula, but the biggest all round risk to the Oil market lies in #Venezuela, writes Nick Butler @NickBb2211. 

"What surprise event of 2018 will shift the energy market out of a complacency that is the result of steady demand matched by plentiful supplies, with the equation balanced not just by the Opec quota but also by the continuing decline in Venezuelan production.

It is hard to identify any factor within the industry that could reshape the market…Any real change will come from events in the external political environment. "
"to me the most likely — risk lies in Venezuela, the most unstable state within Opec. The country's inflation is beyond counting. The economy, civil society and government have broken down. The army is a caricature of corruption. President Nicolás Maduro remains in power but his position is weak. The danger is that in extremis he seeks a convenient enemy against which to unite the nation and embarrass the Venezuelan opposition. 

"The most likely target is Guyana — the subject of a long-running territorial dispute. Recently, I wrote about the new offshore oil discoveries. The beginning now of the process of development of those fields, which are due on stream by 2020, could provide an excuse for Venezuelan intervention in the disputed area east of the Essequibo river."

Read the whole piece by Nick Butler @NickBb2211 online @FT: https://www.ft.com/content/d76e9ac4-1d67-11e8-aaca-4574d7dabfb6

Sunday, March 4, 2018

About ⅔ of utility-scale #batterystorage power capacity installed in 2016 in US is located in 2 electricity markets: #California (CAISO), & #PJMInterconnection, in all or parts of 13 eastern states & DC. @EIAgov

The design and application of utility-scale battery storage varies by region - Today in Energy - U.S. Energy Information Administration (EIA)
The design and application of utility-scale battery storage varies by region
February 28, 2018 U.S. utility-scale battery storage capacity by region, as explained in the article text

About two-thirds of utility-scale battery storage power capacity installed in 2016 in the United States is located in two electricity markets: the California Independent System Operator (CAISO), which covers much of California, and the PJM Interconnection, which covers all or parts of 13 eastern states and the District of Columbia. Utility-scale battery systems have been installed in these markets for different reasons. Utility-scale battery storage systems in California tend to serve energy-oriented applications, with smaller power capacities but longer discharge durations. Conversely, systems in PJM tend to serve power-oriented applications, with larger power capacities but shorter discharge durations.
Unlike most electricity generators, which can be characterized by their power capacity, batteries are characterized by two metrics: power capacity and energy capacity. Power capacity, measured in megawatts (MW), is the maximum instantaneous amount of power that can be produced on a continuous basis. Energy capacity, measured in megawatthours (MWh), is the total amount of energy that can be stored or discharged by the battery.

Saturday, March 3, 2018

Welfare Gains from Market Insurance: The Case of #Mexican #Oil Price #Hedge @IMF

Over the past two decades, Mexico has hedged oil price risk through the purchase of put options.... We show that hedging increases welfare by reducing income volatility and reducing risk spreads on sovereign debt. We find welfare gains equivalent to a permanent increase in consumption of 0.44 percent with 90 percent of these gains stemming from lower risk spreads.

ShareThis

MasterEnergy News