Search This Blog

Showing posts with label EIA. Show all posts

Friday, March 6, 2020

US crude #Oil exports increased 45% to ~3MM b/d in 2019 @EIA_gov #OOTT #TWIP

Figure 1. Annual U.S. crude oil exports (1920-2019)
U.S. crude oil exports averaged 2.98 million barrels per day (b/d) in 2019, an increase of 930,000 b/d (45%) from 2018 (Figure 1). 
The number of destinations for U.S. crude oil exports increased from 41 to 44, and Canada continued to receive the largest share (15%, or 459,000 b/d), followed by South Korea (14%, or 426,000 b/d). U.S. crude oil exports to China, the third-largest export destination in 2018, fell by nearly 100,000 b/d to average 133,000 b/d in 2019. Decreased U.S. crude oil exports to China were more than offset by increases to other destinations, resulting in shifting trade patterns. The growth in U.S. crude oil exports was driven by increasing U.S. crude oil production, expanding domestic infrastructure, and increased global demand for light, low-sulfur crude oils.

Thursday, September 13, 2018

US is now the largest global crude #oil producer-EIA

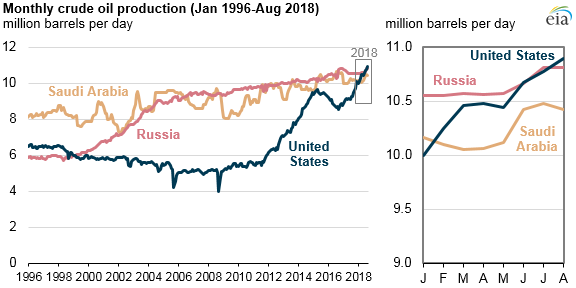
monthly crude oil production

The United States is now the largest global crude oil producer - Today in Energy


September 12, 2018


The United States likely surpassed Russia and Saudi Arabia to become the world’s largest crude oil producer earlier this year, based on preliminary estimates in EIA’s Short-Term Energy Outlook (STEO). In February, U.S. crude oil production exceeded that of Saudi Arabia for the first time in more than two decades. In June and August, the United States surpassed Russia in crude oil production for the first time since February 1999.
Although EIA does not publish crude oil production forecasts for Russia and Saudi Arabia in STEO, EIA expects that U.S. crude oil production will continue to exceed Russian and Saudi Arabian crude oil production for the remaining months of 2018 and through 2019.
U.S. crude oil production, particularly from light sweet crude oil grades, has rapidly increased since 2011. Much of the recent growth has occurred in areas such as the Permian region in western Texas and eastern New Mexico, the Federal Offshore Gulf of Mexico, and the Bakken region in North Dakota and Montana.
The oil price decline in mid-2014 resulted in U.S. producers reducing their costs and temporarily scaling back crude oil production. However, after crude oil prices increased in early 2016, investment and production began increasing later that year. By comparison, Russia and Saudi Arabia have maintained relatively steady crude oil production growth in recent years.
Saudi Arabia's crude oil and other liquids production data are EIA internal estimates. Russian data mainly come from the Russian Ministry of Oil, which publishes crude oil and condensate numbers. Other sources used to inform these estimates include data from major producing companies, international organizations (such as the International Energy Agency), and industry publications, among others.
Principal contributors: Candace Dunn, Tim Hess

Sunday, March 4, 2018

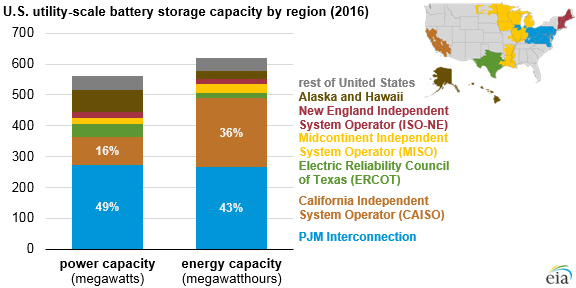
About ⅔ of utility-scale #batterystorage power capacity installed in 2016 in US is located in 2 electricity markets: #California (CAISO), & #PJMInterconnection, in all or parts of 13 eastern states & DC. @EIAgov

The design and application of utility-scale battery storage varies by region - Today in Energy - U.S. Energy Information Administration (EIA)
The design and application of utility-scale battery storage varies by region
February 28, 2018 U.S. utility-scale battery storage capacity by region, as explained in the article text

About two-thirds of utility-scale battery storage power capacity installed in 2016 in the United States is located in two electricity markets: the California Independent System Operator (CAISO), which covers much of California, and the PJM Interconnection, which covers all or parts of 13 eastern states and the District of Columbia. Utility-scale battery systems have been installed in these markets for different reasons. Utility-scale battery storage systems in California tend to serve energy-oriented applications, with smaller power capacities but longer discharge durations. Conversely, systems in PJM tend to serve power-oriented applications, with larger power capacities but shorter discharge durations.
Unlike most electricity generators, which can be characterized by their power capacity, batteries are characterized by two metrics: power capacity and energy capacity. Power capacity, measured in megawatts (MW), is the maximum instantaneous amount of power that can be produced on a continuous basis. Energy capacity, measured in megawatthours (MWh), is the total amount of energy that can be stored or discharged by the battery.

ShareThis

MasterEnergy News